This document is meant to outline a process for analyzing problem queries.
1 - Get Information from User.
The user needs to provide a minimal amount of information to help track down the problems. For instance:
| a. - | What is the priority to find the solution? What is the deadline? |
| b. - | What system was he running on? |
| c. - | What ID was he running as? |
| d. - | When did the error occur? |
| e. - | What specific errors were encountered? |
| f. - | How many times did he try? |
| g. - | What was he running in (Mainframe job, BTEQ session, Querymanager, etc.)? |
| h. - | When was the last time it succeeded? What conditions was it run under then?
Does he have an explain or output from a successful run? |
| i. - | Have him provide you with a softcopy of the precise query (ies) that failed.
You want precise examples, where clauses, conditions, etc. If he has one that
worked and one that failed, get both. |
| j. - | Have him provide you with any error messages, partial outputs, etc. |
| k. - | Is he aware of any significant changes to the data? New countries, new codes, etc. |
2 - Get Basic Information on Views and Schemas.
You want to identify all tables in the query, get an idea of how they fit together, how large they are, how are they distributed,
etc.
Here are two UNIX scripts to help you:
check_views
check_schema
You want to run these on the system that is experiencing the problem.
The first is check_views (usage: check_views logon_id password table). This script will get the description of the view and the
number of rows the view will pull up. Note: If there is a condition needed by the view, for instance, it may restrict the
rows to the countries that the user is authorized to see, this may not give you the same numbers that the user will see. This script
puts data into a local file called views.txt. The following is a sample output from this file:
     -------------------------------------------------------------
     REPLACE VIEW DEIW702.VIW_RPT_PER_WK
       AS LOCKING DEIW702T.TRPW702 FOR ACCESS
        SELECT
             RPT_PER_WK_CD (INTEGER) ,
             RPT_PER_MTH_CD (INTEGER),
             RPT_PER_WK_END_DT (DATE, FORMAT 'DD-MMM-YYYY'),
             RPT_PER_WK_SPAN (INTEGER),
             RPT_PER_WK_SEQ_NBR (INTEGER)
       FROM DEIW702T.TRPW702 WITH CHECK OPTION


        Count(*)
     -----------
             364
This is especially useful for finding out what tables are used and what aliases are used. Note: The explain will
identify tables by the aliases instead of the table names, if aliases are used.
The second script is check_schema (usage: check_schema logon_id password database table). This script runs a show table, help
statistics, select count and an amp usage for a table. Note: According to Jon Christie (NCR), this script will provide the
basic information that he requires to analyze a problem query. This is useful for finding out things like what indexes are
available, are stats current, how many unique values are there, how many rows in the table, is the table well distributed, or is
there a possibility that there is a hot-amp.
     -------------------------------------------------------------
     CREATE SET TABLE deiw700t.tbar700 ,NO FALLBACK ,
          NO BEFORE JOURNAL,
          NO AFTER JOURNAL
          (
           BTLR_ORG_ID INTEGER NOT NULL,
           BAS_ARTL_NBR INTEGER NOT NULL,
           PKG_CD CHAR(3) NOT CASESPECIFIC NOT NULL,
           BEV_PHYS_STTE_CD INTEGER NOT NULL,
           BEV_PROD_CD CHAR(4) NOT CASESPECIFIC NOT NULL,
           CONS_PRMO_TYPE_CD INTEGER,
           STD_CASE_CONV_RAT DECIMAL(9,6) NOT NULL,
           BTLR_ARTL_ACTV_DT DATE FORMAT 'DD-MMM-YYYY',
           BTLR_ARTL_INAC_DT DATE FORMAT 'DD-MMM-YYYY',
           INTL_INV_ITEM_ID INTEGER,
           UNT_CASE_CONV_RAT FLOAT NOT NULL,
           BAS_ARTL_NM VARCHAR(50) NOT CASESPECIFIC)
     UNIQUE PRIMARY INDEX XPKTBAR700N ( BTLR_ORG_ID ,BAS_ARTL_NBR )
     INDEX XIF493TBAR700 ( BTLR_ORG_ID )
     INDEX XIF494TBAR700 ( CONS_PRMO_TYPE_CD )
     INDEX XIF495TBAR700 ( PKG_CD ,BEV_PHYS_STTE_CD ,BEV_PROD_CD )
     INDEX XIF496TBAR700 ( BAS_ARTL_NBR );


     Date     Time      Unique Values        Column Names
     -------- -------- -------------- -----------------------------------
     99/10/19 07:18:49             17 BTLR_ORG_ID
     99/10/19 07:18:51          2,740 BAS_ARTL_NBR
     99/10/19 07:18:49              3 CONS_PRMO_TYPE_CD
     99/10/19 07:18:51          3,545 BTLR_ORG_ID,BAS_ARTL_NBR
     99/10/19 07:18:50            989 PKG_CD,BEV_PHYS_STTE_CD,BEV_PROD_CD


        num_rows
     -----------
            3545


      total_size   num_amps   max_bytes_per_amp   min_bytes_per_amp  percent_diff
     -----------  ---------  ------------------  ------------------  ------------
         559,616         12              51,200              39,424         23.00
You can use SQL to reduce the amount of work in building calls to these scripts by running a query like (it builds a
check_schema call for each table in sysadm on Brussels):.
     select 'check_schema  cokee.eur.ko.com/userid password '
       || trim(databasename) || ' ' || trim(tablename)

       from dbc.tables

       where databasename = 'sysadm'
       order by databasename, tablename
You can then cut and paste the output to the UNIX box and run all of these statements. These UNIX scripts append data to
the two output files, so you can run them sequentially and build a single output file
Note: You may need to remove the files before you start in order to eliminate old runs.
Note: When running scripts in Belgium, we found that it was necessary to specify the cokee address. It doesn't hurt and
may be a good habit to get into.
3 - Map the Data.
Draw out all of the tables that are involved in the query. One shortcut is to use the ERWIN models to give you a preliminary set.
Make sure that you identify:
The aliases of each table. The explain will show aliases when used.
Identify the columns that are used in Joins, where clauses, or that are used in the final select set.
Draw a solid curve between all of the Joins explicitly spelled out in the Query (or through the views). When the two
operands are equal, then they are called bind terms, otherwise they are termed cross terms. If it is not an equality relationship,
mark the relationship on the diagram. If it is an expression (mathematical or otherwise), place the expression in the diagram.
Draw a dashed curve between all of the implicit equality relationships (or transient terms), for instance if
A = B and B = C is specified in the query, then A = C is implied (note: The converse relationship is
not true). In addition, inequality transitive terms, e.g., A > C and C > B inferring A > B, are not
handled by the optimizer.
Note how many rows are in each table.
Use the schema and statistics to identify the Primary and Secondary Indexes and how many unique values there are in
each one. You do not have to worry about indexes with multiple columns unless all of the columns are referenced. If only two out of
three columns in an index are referenced, then the index is of no use to the optimizer.
This is an example from Jon Christie's class:
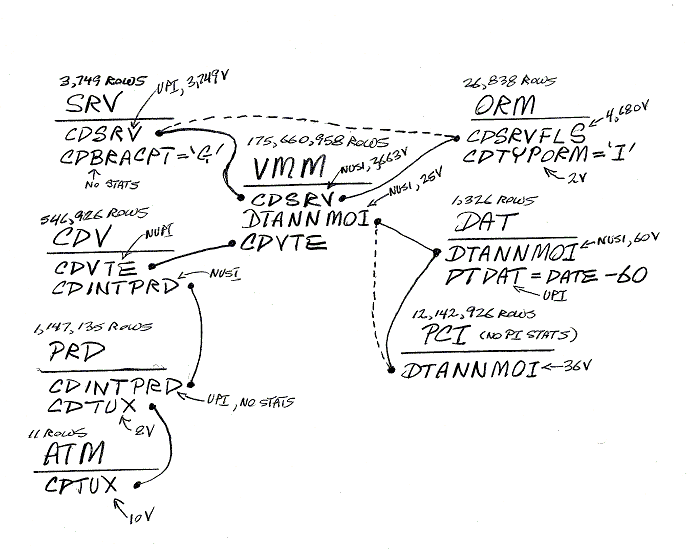
Use this diagram to try to identify:
Redundant tables.
Cartesian Products (missing join clauses).
Tables that may end up with a poor distribution if they are redistributed on a non-primary index key.
Columns in where clauses or join steps without statistics.
Incorrect identification of large tables to be redistributed (look for large table/small table joins).
Transitive terms that if explicitly identified may help the optimizer.
Note: Large table/small table join is defined to be a 100:1 row ratio.
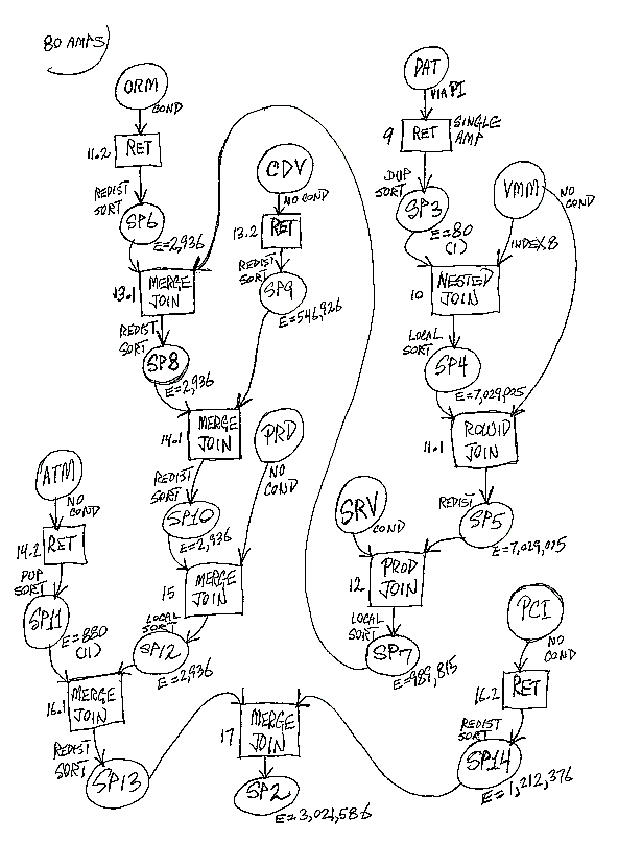
4 - Map the Explain(s)
Note: I would recommend that this be done in a graphics tool, such as Visio for three reasons, readability, being able to
move stuff around as you draw it, and the ability to make multiple copies in order to draw test changes over the explain. I found
the latter extremely helpful in understanding differences in solutions. This is a partial example of one that I completed:
Note: The R+S in step 2.2 means that the spool file was redistributed and sorted. The MJ in step 4.2 means a merge join.
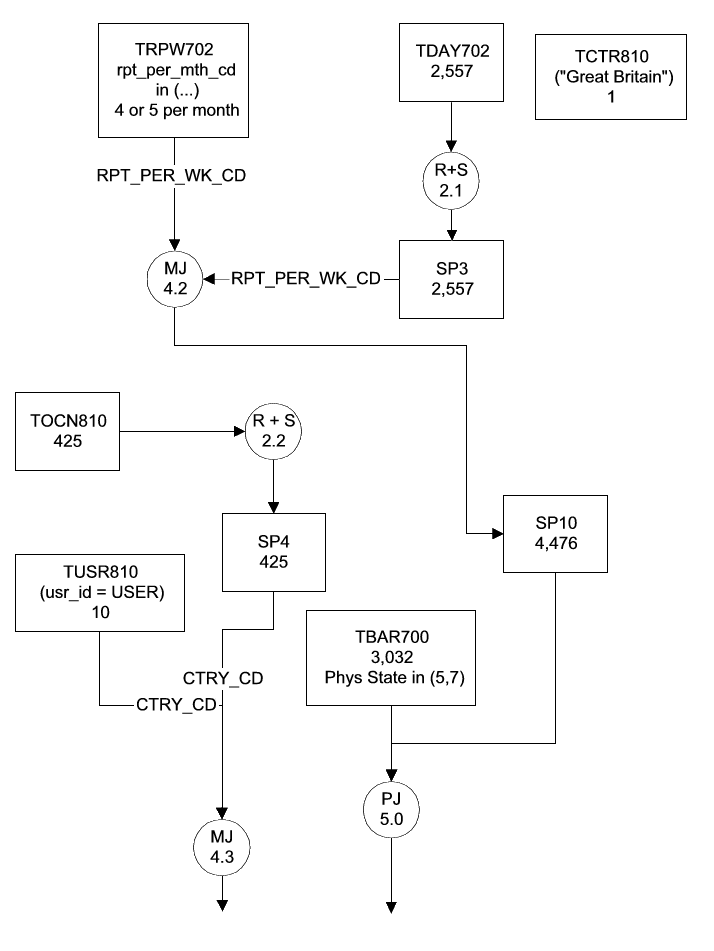
Alternatively, this is the example from Jon's class:
Starting with the final spool file, draw each of the previous tables/spool files and note how they are joined.
Alternatively, you can start with the first step of the explain and work towards the final result. Note the estimated sizes for
each spool file. The biggest differences in the two methods that I noted were, He used boxes for the operations and circles for the
spool files/tables, and I did the opposite (purely, because the boxes were bigger than the circles in Visio) and that he put the
geography (or distribution) of the spool files on the spool file. I got a little lazy in my example.
Note the type of join (Merge Join, product join, or nested join), join conditions, and where clauses at each stage.
Note when spool files are redistributed and sorted, duplicated, or built locally. Note when duplicates are removed.
Keep track of which table is the Left table (first table mentioned in the explain step) and the right table, (second one mentioned
in the explain step). Note the optimizer only joins two tables at a time.
In a nested join, the right table will have a secondary index on the join column. This will usually be a nUSI, but may be an USI
as well. You want a small table on the left side. It may be duplicated on all AMPs.
I thought this discussion on nested joins from Jon Christy was interesting:
There are several flavors of nested joins. The one in my presentation is the kind of nested join I see most often
in explains. It is a kind of join where two physical joins (a nested join retrieving rowids only from the right table, followed by a
rowid join) are performed to accomplish one logical join. In this kind of join, the right table in the nested join step MUST have a
NUSI and there must be a join term or terms which cover that NUSI. The left table in the nested join MUST be duplicated on all amps.
This is because NUSIs are not hash distributed. They are local (the rowids in the secondary index subtable are rowids only of rows
on the same amp). In the following rowid join, the left table is the spool produced by the nested join, and the right table is the
table with the NUSI, only in this step we are accessing the primary subtable instead of the NUSI subtable we were accessing in the
nested join step. There are several flavors of nested joins. The one in my presentation is the kind of nested join I see most often
in explains. It is a kind of join where two physical joins (a nested join retrieving rowids only from the right table, followed by
a rowid join) are performed to accomplish one logical join. In this kind of join, the right table in the nested join step MUST have
a NUSI and there must be a join term or terms which cover that NUSI. The left table in the nested join MUST be duplicated on all
amps. This is because NUSIs are not hash distributed. They are local (the rowids in the secondary index subtable are rowids only of
rows on the same amp). In the following rowid join, the left table is the spool produced by the nested join, and the right table is
the table with the NUSI, only in this step we are accessing the primary subtable instead of the NUSI subtable we were accessing in
the nested join step.
Note: The estimates are the sum of the estimates for each AMP. For instance if a 10 row table is duplicated on 12 AMPs,
then the estimate will be 120. If a 10 row table is distributed, then the estimate is also 10 amps. Size estimates are not given
when there are no alternatives. If any step has no alternatives, then a final cost will not be generated. Note: We have
also seen cases where the estimates for summated requests were the square root of the actual number (I understand that this feature
is corrected in V2R3).
If you see the join condition '(1=1)' then this is a made-up condition to allow the product join to occur.
Things to look for:
Are the estimates correct? If the estimate is off, then the optimizer could be making a very poor choice.
Is the process doing product joins with large tables? There are two kinds of product joins. One is not bad, it is in
place of a Merge Join where a sort is not needed. The second where you essentially perform a cartesian product can be bad. I
believe that you can tell the two apart, because the cartesian product type will give an estimate that is the multiplication of the
two input estimates. The merge join estimate will give you an estimate that is close to the input estimates. Product joins of small
tables can be very fast, especially if the left table is small enough to stay in memory. Jon gave a very good discussion of this
join:
There is just one Product Join, but there are a couple of different geographies used with Product Joins, and they
have somewhat different performance characteristics. I'm afraid I've fallen into the habit of calling them two different Product
Joins which is not strictly true.
The first geography is left table duplicated and right table either direct (straight from the table with no
intermediate retrieve step) or local (in the case of a spool file). For this geographic variation to perform well, the left table
must be fairly small since duplicating it is going to multiply its size by the number of amps in the system. How small is "fairly
small?" That depends on the size of the rows. Left table rows are read into a buffer in order to reduce the number of times a
Product Join needs to perform a full file scan of the right table. The size of that buffer is six 32K segments. Knowing the
estimated number of rows in one copy of the left table and estimating the size of the rows by adding together the size of all the
columns (columns referenced anywhere in the SQL request go into spool file, but un-referenced columns do not) and adding about 20
bytes for overhead, you can make a rough estimates of how many buffers the left table will fill. If you can fit the whole left table
in the buffer, you've got a good deal. If it takes a couple of buffers, you've still got a good deal. But after that, you may have
a problem. Especially if the right table is really huge.
The second geography is the geography usually associated with merge joins except that the input relations do not
need to be sorted by rowhash. For this kind of geography to work, there must be at least one connecting term between the two tables
and the tables must be compatibly hash distributed based on the columns referenced in the term(s). This does not necessarily mean
that either of the input relations must be a redistributed spool file. Perhaps the connecting terms cover the primary index of one
of the tables.
We can access such a table directly. Perhaps we are dealing with a spool file which has already been distributed
the way we need it (perhaps because of a previous join on the same column or columns.) Such a spool file could be written locally.
The advantage we have here is that we do not have to duplicate the left table. So when figuring if the left table can fit in the
buffer, you divide the estimated number of rows in the table by the number of amps in the system.
The most common form of nested join consists of two physical join steps. First it grabs everything from the left table
and the row-id from the right table. Then it redistributes this output by second table row-id and matches it to the second table in
a ROWID join.
5 - Make Queries to Explore Suspect Spool Files (Get Size and Distribution).
Extract the where clauses that reference every table in the spool file and nothing that references anything else. Include
transient terms, these are your implicit join conditions (see section 3). The basic form is:
     SELECT sum(cnt) as total_rows,
            count(*) as total_amps,
            max(cnt) as Max_rows_per_amp,
            min(cnt) as min_rows_per_amp,
            avg(cnt) as avg_rows_per_amp

       FROM (SELECT hashamp(hashbucket(hashrow(primary_index))), count(*)
               FROM tables
               WHERE where_clauses
               Group by  1
            ) dt (a, cnt);
Where the primary_index is related to the table (or spool file) that you are joining to in the next step. To join two
tables together, the rows that will be joined must be on the same amp. If they are not already on the same amp (the resulting spool
file is created locally), there are two methods used, duplicate or redistribute. What you are looking for is if the total_rows is
close to the Explain estimate or if the spool file is poorly distributed.
Obviously, if a spool file is duplicated, then all you need to do is find out how many rows would be in the spool file using the
where clauses for the joined tables.
6 - Look for Alternatives to Fix the Problem.
This is very dependent on the identified problem(s). This is where discussions with the applications group are critical. There
may be something that is fishy, but it is correct. You may need to bring NCR into the picture at this point. Don't be afraid to ask
for help.
| a. - | Fix Cartesian products |
| b. - | Eliminate redundant tables. |
| c. - | If an estimate is very incorrect. Look for a join column that does not have statistics on it. If a
join condition does not use all of the members of an index, then that index and its statistics will be ignored. The fix may be to
add statistics and/or an index. |
| d. - | See if explicitly adding a transitive relationship will significantly change the explain. If it is
not there an index may not be used. |
| e. - | Look if you mix datatypes in the where clauses or join conditions. Changing datatypes can effect
the explain or radically effect the performance without touching the explain.
According to Marshall, because the Hashing algorithm is dependent on the datatype of the primary index, if you mix types on an index
join or where condition, the index cannot be used.
According to Jon Christy, this can also defeat the use of statistics. |
| f. - | If you use a subquery or a derived table, then you can currently (this may be eliminated in V2R4)
force the optimizer to do this step first. This may be useful in forcing product joins of small look-up tables to get a good merge
join with your large fact table. |
| g. - | Look at breaking up the query with intermediate results. |
| h. - | Look for denormalization improvements. |
| i. - | Is more spool space needed? |
| j. - | If an alias has been defined for a table, then carry the alias all the way through the query. If
you don't, Teradata will assume that you mean two copies of the table, one with the alias and one without. |
7 - Build Test Cases and Run Explains of Them.
Select the most likely corrective actions. Be conservative with table changes, this may cause a problem with other queries.
However, the application team is going to be conservative with changes to production queries. Build the modified queries, database
changes, etc. and try them out. Use your mapping diagram to see what each test case did to the explain. See if the estimates are
better and that you have more reasonable use of product joins.
If a table change is needed, especially a Primary Index change, we will request that all SQL using that table be identified and
tested by the application group prior to implementation.
8 - Closing the Issue.
This is probably the most difficult step. You may need to simply report your findings and discuss them with the developer. You
may need to escalate the solution to get action.
9 - Opening an Issue with NCR.
If you are stumped, you may need to open an issue with NCR.
For problems in the USA call 1 800 531 2222 to open problems with GSL.
References
The 1999 NCR Partner's Conference.
Sessions:
- You Too Can Learn to Understand Explains by Jon Christie.
- Explaining the Explain by Paul Derouin
- Teradata Parsing Engine Architecture by Todd Walter.
The Teradata Database Implementation for Performance (1998) by Brian Marshall.
| 